MindPlot
An AI-assisted research assistant that ranges from data analysis to the selection of images for papers
Introduction
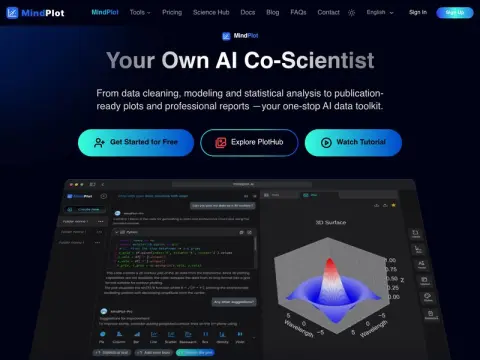
People engaged in scientific research have probably all experienced this cycle: cleaning data, performing statistical analyses, creating charts, adjusting file formats, and writing reports – each step requiring the use of a different software. MindPlot aims to simplify this entire process. It claims to be an “AI collaborative scientist”: after uploading your data and describing your requirements in natural language, it can handle tasks such as data cleaning, modeling, statistical analysis, and generate charts that can be directly used in research papers.
In addition to its core drawing capabilities, it also includes a set of sub-tools for reading papers, writing manuscripts, creating PPTs, and drawing vector diagrams. There is also an open-source chart example library called PlotHub that can be used as a reference. The free version provides 10 usage points per month, while the Pro version costs $15 per month and offers 200 usage points. More advanced versions are designed for researchers who need to use these tools frequently. Graduate students and researchers who often need to create visual presentations will find this software particularly useful.