
RunStocks
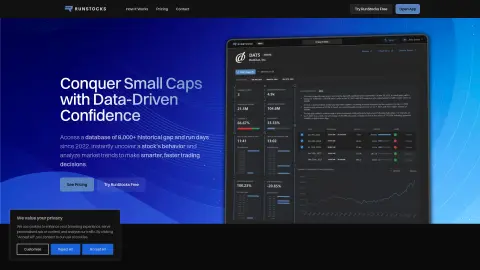
RunStocks analyzes historical data of small-cap stocks to assist intraday traders in making informed decisions.
Introduction
RunStocks analyzes small-cap stocks historical data to help day traders make informed decisions.
What is RunStocks?
RunStocks is a powerful analysis platform designed specifically for day traders of small-cap stocks. By examining historical price fluctuations, trends, and key performance indicators, it helps these traders uncover the true characteristics of small-cap stocks. It provides detailed historical data on stocks that have experienced price changes of 20% or more, as well as increases in value of 50% or more, since 2022. By analyzing price behavior, trading volume trends, and the patterns that emerge after such price movements, traders can identify high-probability trading opportunities and use data-driven insights to optimize their strategies.
How to use RunStocks?
RunStocks enables users to search for stock codes, view key fundamental indicators, analyze historical price changes and price differences, filter current market conditions, predict market trends, use candlestick charts to analyze price movements, and make confident trading decisions based on these data.
The core functions of RunStocks
Analysis of stock characteristics
Intraday price behavior analysis
Daily adjustments in the event of a reverse share split
comprehensive historical data
Optimized for mobile use, allowing for transactions at any time.
Detailed performance indicators
Market trend monitoring
Daily Appreciation and Price Spread Calendar
Basic data that is easily accessible
Insights enhanced by AI
Intraday price behavior analysis
Daily adjustments in the event of a reverse share split
comprehensive historical data
Optimized for mobile use, allowing for transactions at any time.
Detailed performance indicators
Market trend monitoring
Daily Appreciation and Price Spread Calendar
Basic data that is easily accessible
Insights enhanced by AI
Visits:8
Updated:2026-11-07
Related






1
 2
 3
 4
 5
 6
 7
 8
 9
 10

Zlibrary
Zlibrary is known as the world's largest digital library, containing 9,826,996 e-books and 84,837,646 journal articles. From various well-known literary works, science and engineering, humanities and arts, to academic papers, etc.! Support PDF, epu
Sweezy Cursors
Sweezy Cursors is a website that offers a wide range of personalized mouse cursor resources. It features thousands of cursors and pointers with various styles and dynamic effects, covering categories such as anime characters, game weapons, emojis, cartoon animals, technological themes, vector graphics, and popular film and television characters – all designed to suit your needs.
New Orylia AI
AI picture and video generator that remembers your aesthetics
The Legacy App
A platform that uses artificial intelligence to capture and preserve family memories and stories.
Jina AI
Search for AI providers that offer features such as embedding, reordering, and advanced search capabilities.
HeyGen
AI-generated digital human videos
Manifold MCP
An MCP for connecting AI agents to real-time marketing data
Conju – Build AI Powered Apps
Through LLM-driven follow-up and integration with CRM systems, Conju converts unanswered calls into sales opportunities.
LinkFox AI
AI tools designed for cross-border e-commerce
Pica AI
AI art generators are used to create avatars and artistic works based on text and images.
1
2
3
4
 5
 6
 7
 8
 9
 10

Zlibrary
Zlibrary is known as the world's largest digital library, containing 9,826,996 e-books and 84,837,646 journal articles. From various well-known literary works, science and engineering, humanities and arts, to academic papers, etc.! Support PDF, epu
LinkFox AI
AI tools designed for cross-border e-commerce
HeyGen
AI-generated digital human videos
DuiYou AI
Duiyou is a service platform developed by Alibaba Design to support designers throughout their entire career journey. It builds its capabilities around five key user values—quality, efficiency, skills, achievements, and income—to fully serve designers, with the goal of becoming their trusted partner.
Refined through multiple rounds of development by design teams from leading tech companies, Duiyou combines a vast collection of high-quality 3D assets, real-time online rendering, diverse scenario-based applications, a lightweight, easy-to-learn, and user-friendly interface. It also comes with free, commercially usable features, providing professional designers, marketing specialists, students, beginners, and social media influencers with a zero-cost online design platform and resource library.
PixPix
Generation of AI-based e-commerce templates and videos
Riffusion
Generative AI musical instruments enable the creation, remixing, and sharing of high-quality songs based on textual prompts.
OptimizerAI
The AI sound effect generator is capable of generating an unlimited number of high-quality sounds based on text or audio input.
StockTune
StockTune provides AI-generated royalty-free music for content creators to use without attribution.
PDF Converter
Free online tool for converting and editing PDF files.
A Cost-Effective Guide to Living a Better Life: HowToLiveBetter
Which membership services on my phone are automatically deducting fees from my account? Is the password for my main email address the same as that used on other websites? In the rental contract, when exactly will the deposit be refunded? Each of these issues, taken separately, is not particularly complicated. However, without anyone reminding you, it’s very easy to make mistakes. Today, I’d like to share a GitHub repository with 60.5k stars…
1
2
3
4
5
6
7
8
9
10
Zlibrary
Zlibrary is known as the world's largest digital library, containing 9,826,996 e-books and 84,837,646 journal articles. From various well-known literary works, science and engineering, humanities and arts, to academic papers, etc.! Support PDF, epu
LinkFox AI
AI tools designed for cross-border e-commerce
HeyGen
AI-generated digital human videos
DuiYou AI
Duiyou is a service platform developed by Alibaba Design to support designers throughout their entire career journey. It builds its capabilities around five key user values—quality, efficiency, skills, achievements, and income—to fully serve designers, with the goal of becoming their trusted partner.
Refined through multiple rounds of development by design teams from leading tech companies, Duiyou combines a vast collection of high-quality 3D assets, real-time online rendering, diverse scenario-based applications, a lightweight, easy-to-learn, and user-friendly interface. It also comes with free, commercially usable features, providing professional designers, marketing specialists, students, beginners, and social media influencers with a zero-cost online design platform and resource library.
PixPix
Generation of AI-based e-commerce templates and videos
Riffusion
Generative AI musical instruments enable the creation, remixing, and sharing of high-quality songs based on textual prompts.
OptimizerAI
The AI sound effect generator is capable of generating an unlimited number of high-quality sounds based on text or audio input.
StockTune
StockTune provides AI-generated royalty-free music for content creators to use without attribution.
PDF Converter
Free online tool for converting and editing PDF files.
A Cost-Effective Guide to Living a Better Life: HowToLiveBetter
Which membership services on my phone are automatically deducting fees from my account? Is the password for my main email address the same as that used on other websites? In the rental contract, when exactly will the deposit be refunded? Each of these issues, taken separately, is not particularly complicated. However, without anyone reminding you, it’s very easy to make mistakes. Today, I’d like to share a GitHub repository with 60.5k stars…