Flourish
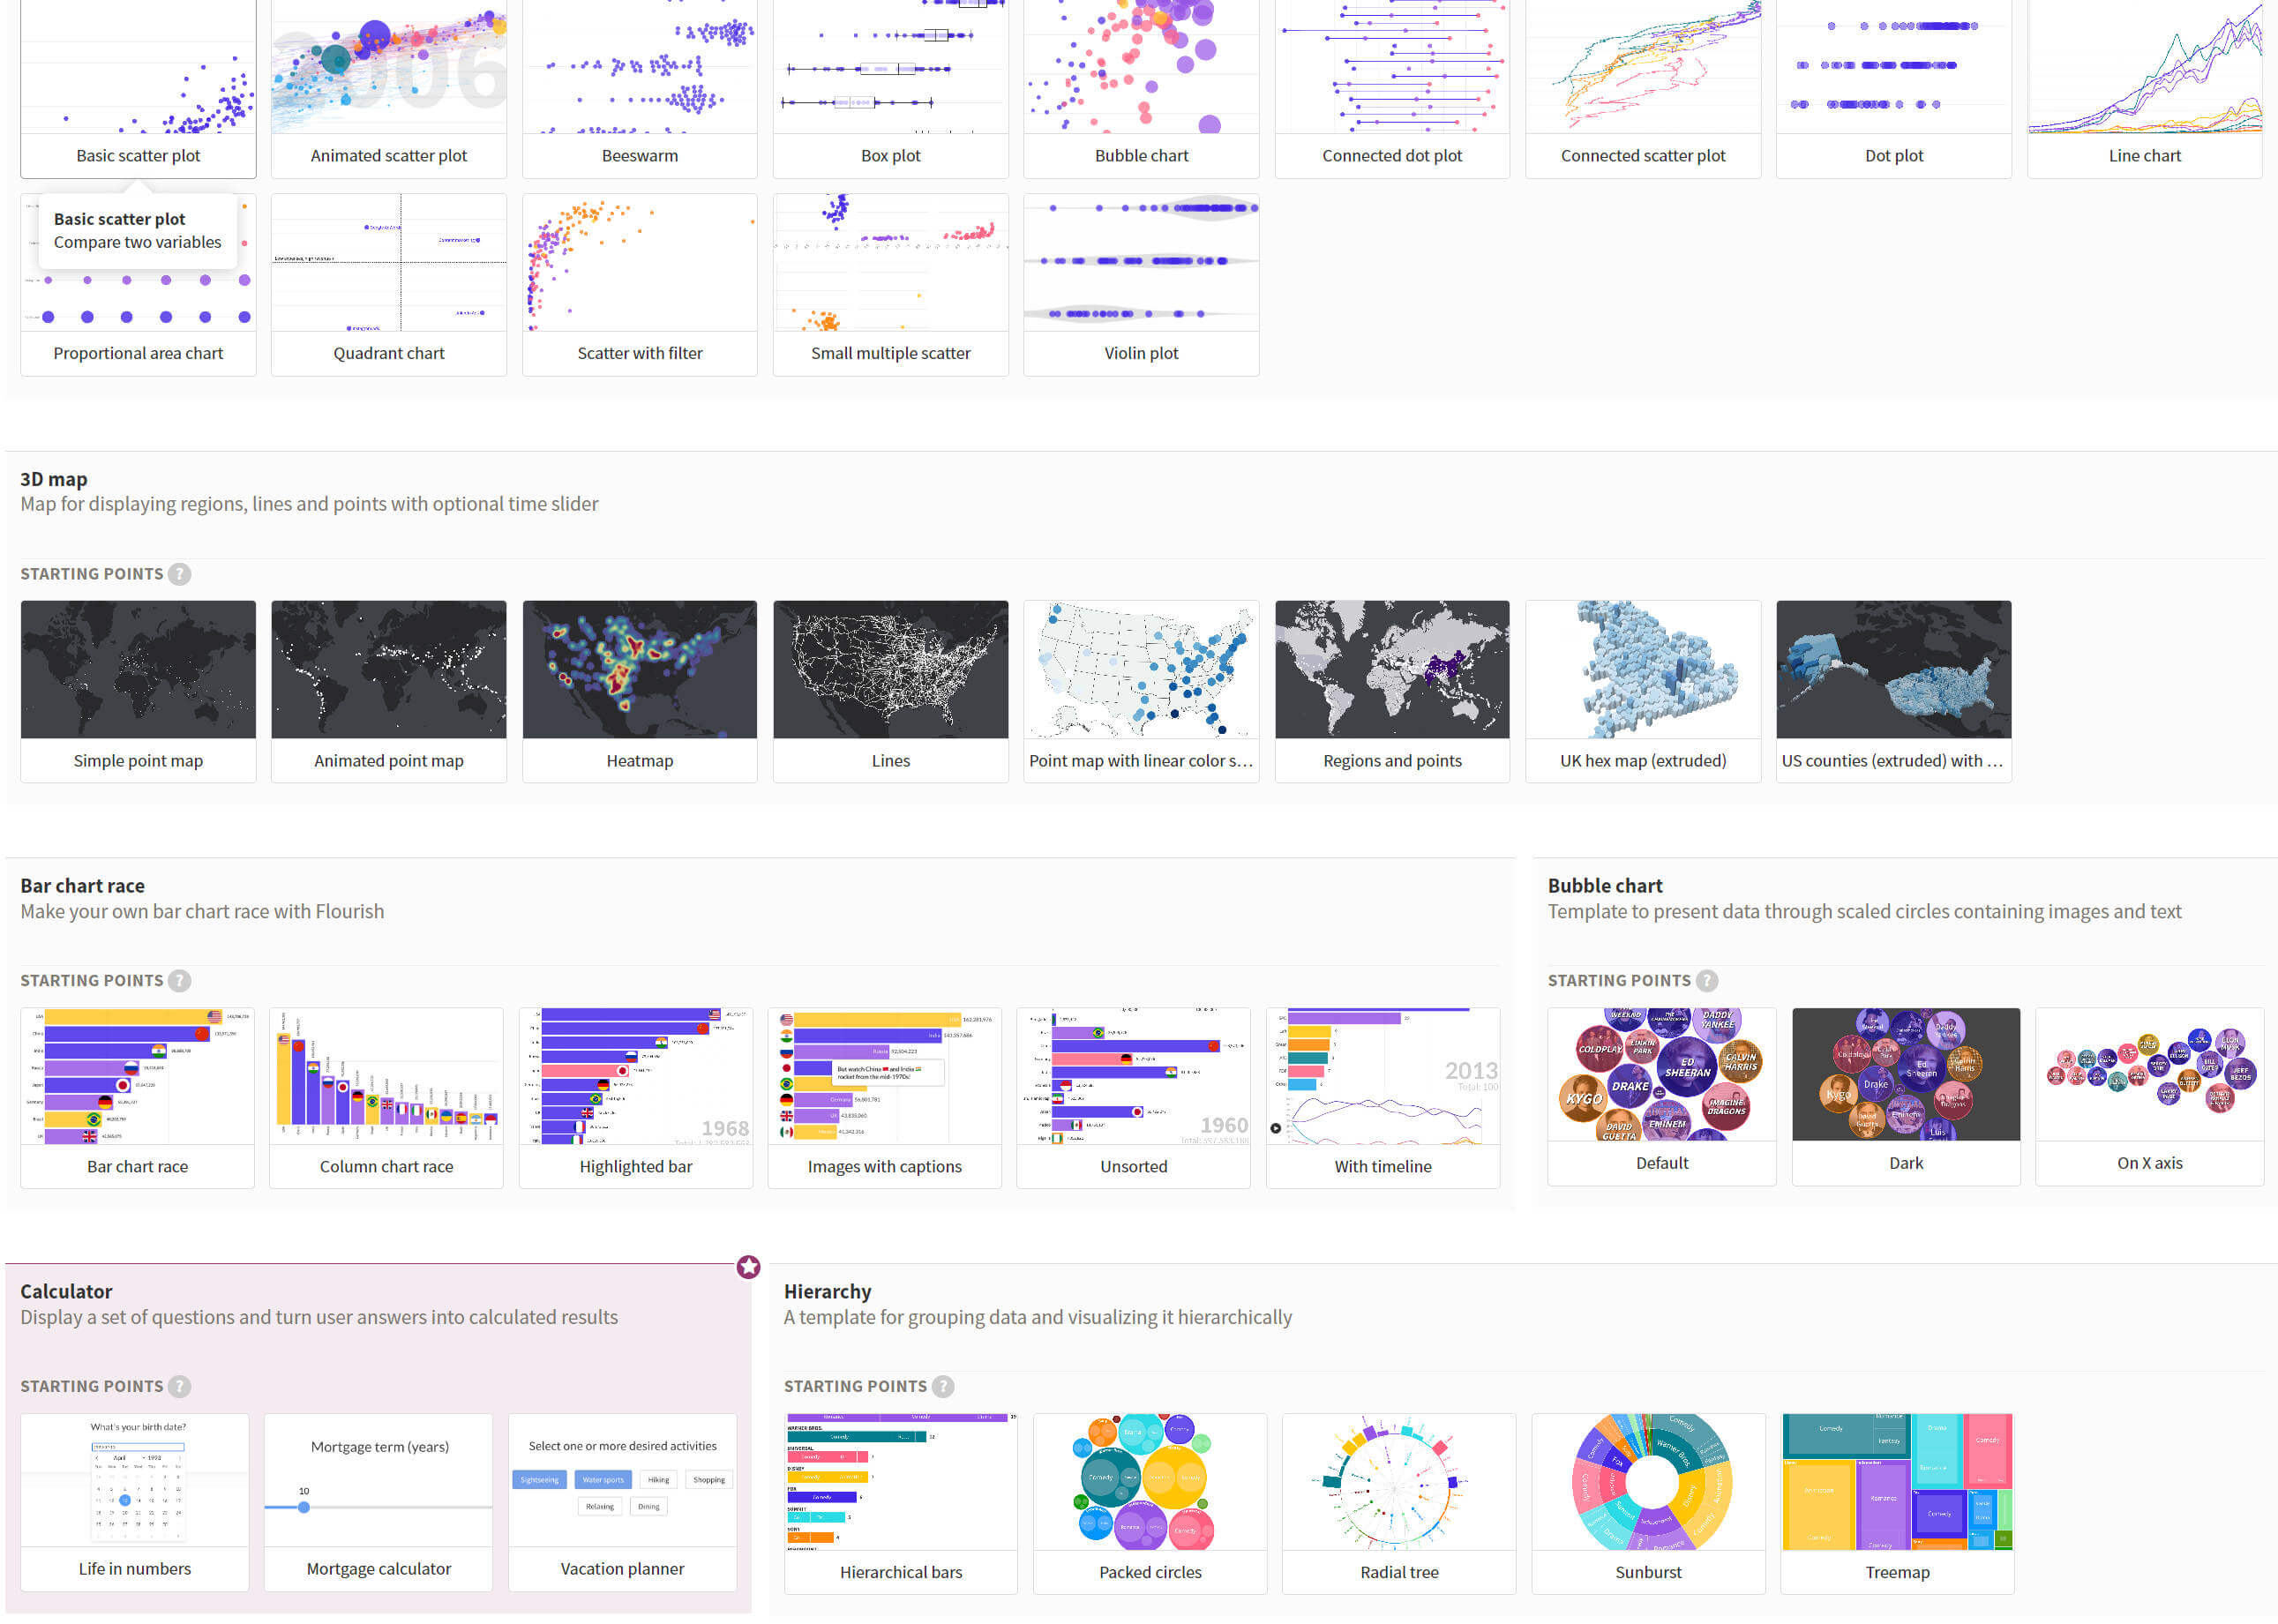
Flourish is a data visualization tool that offers a rich collection of high-quality chart templates. Simply upload your data, and it will automatically generate stunning, dynamic visualizations for you – making it an excellent tool for creating reports or presentations. Those popular ranking videos with millions of views that we see on short-video platforms can also be created using Flourish.
Introduction
Flourish is a data visualization tool that offers a vast range of high-quality chart templates. Simply upload your data, and the software will automatically generate stunning, dynamic visualizations for you – making it an invaluable asset for creating reports or presentations.
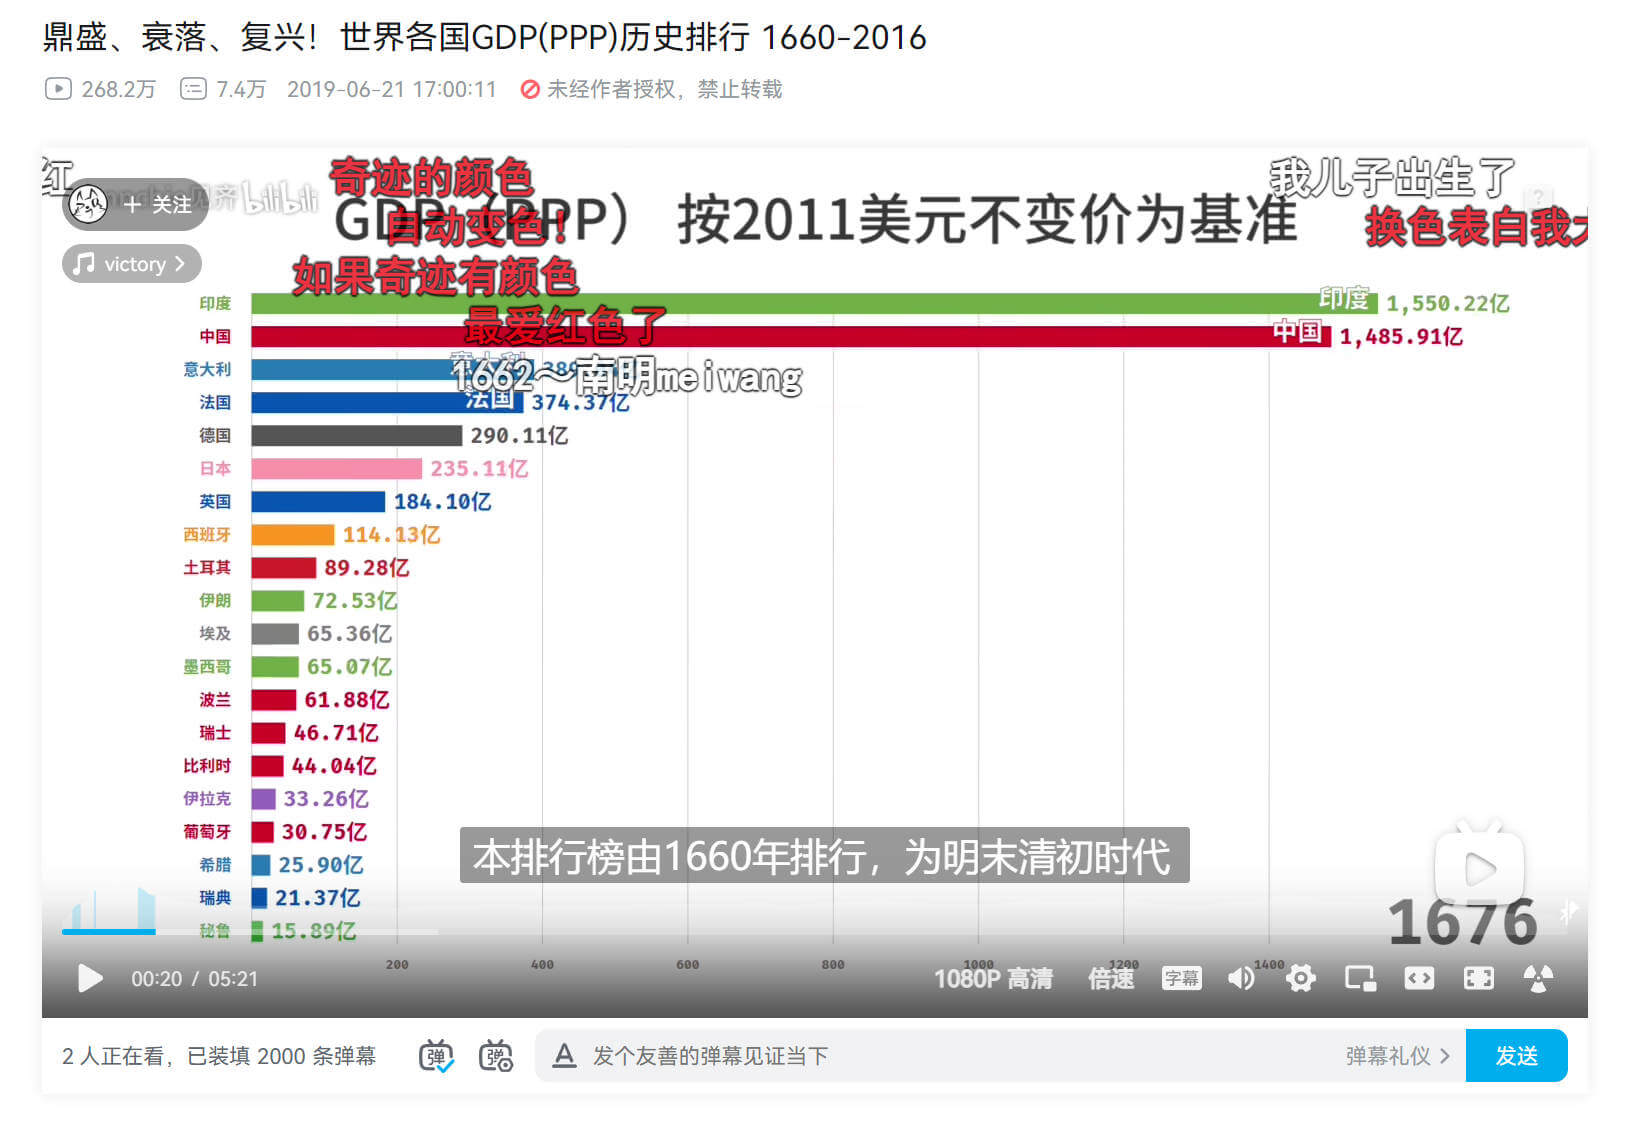
The type of ranking videos that achieve millions of views and can be seen on short-video platforms can be directly generated by Flourish.
Find the corresponding template and then import the data directly – in this way, the dynamic bar chart will be generated automatically.
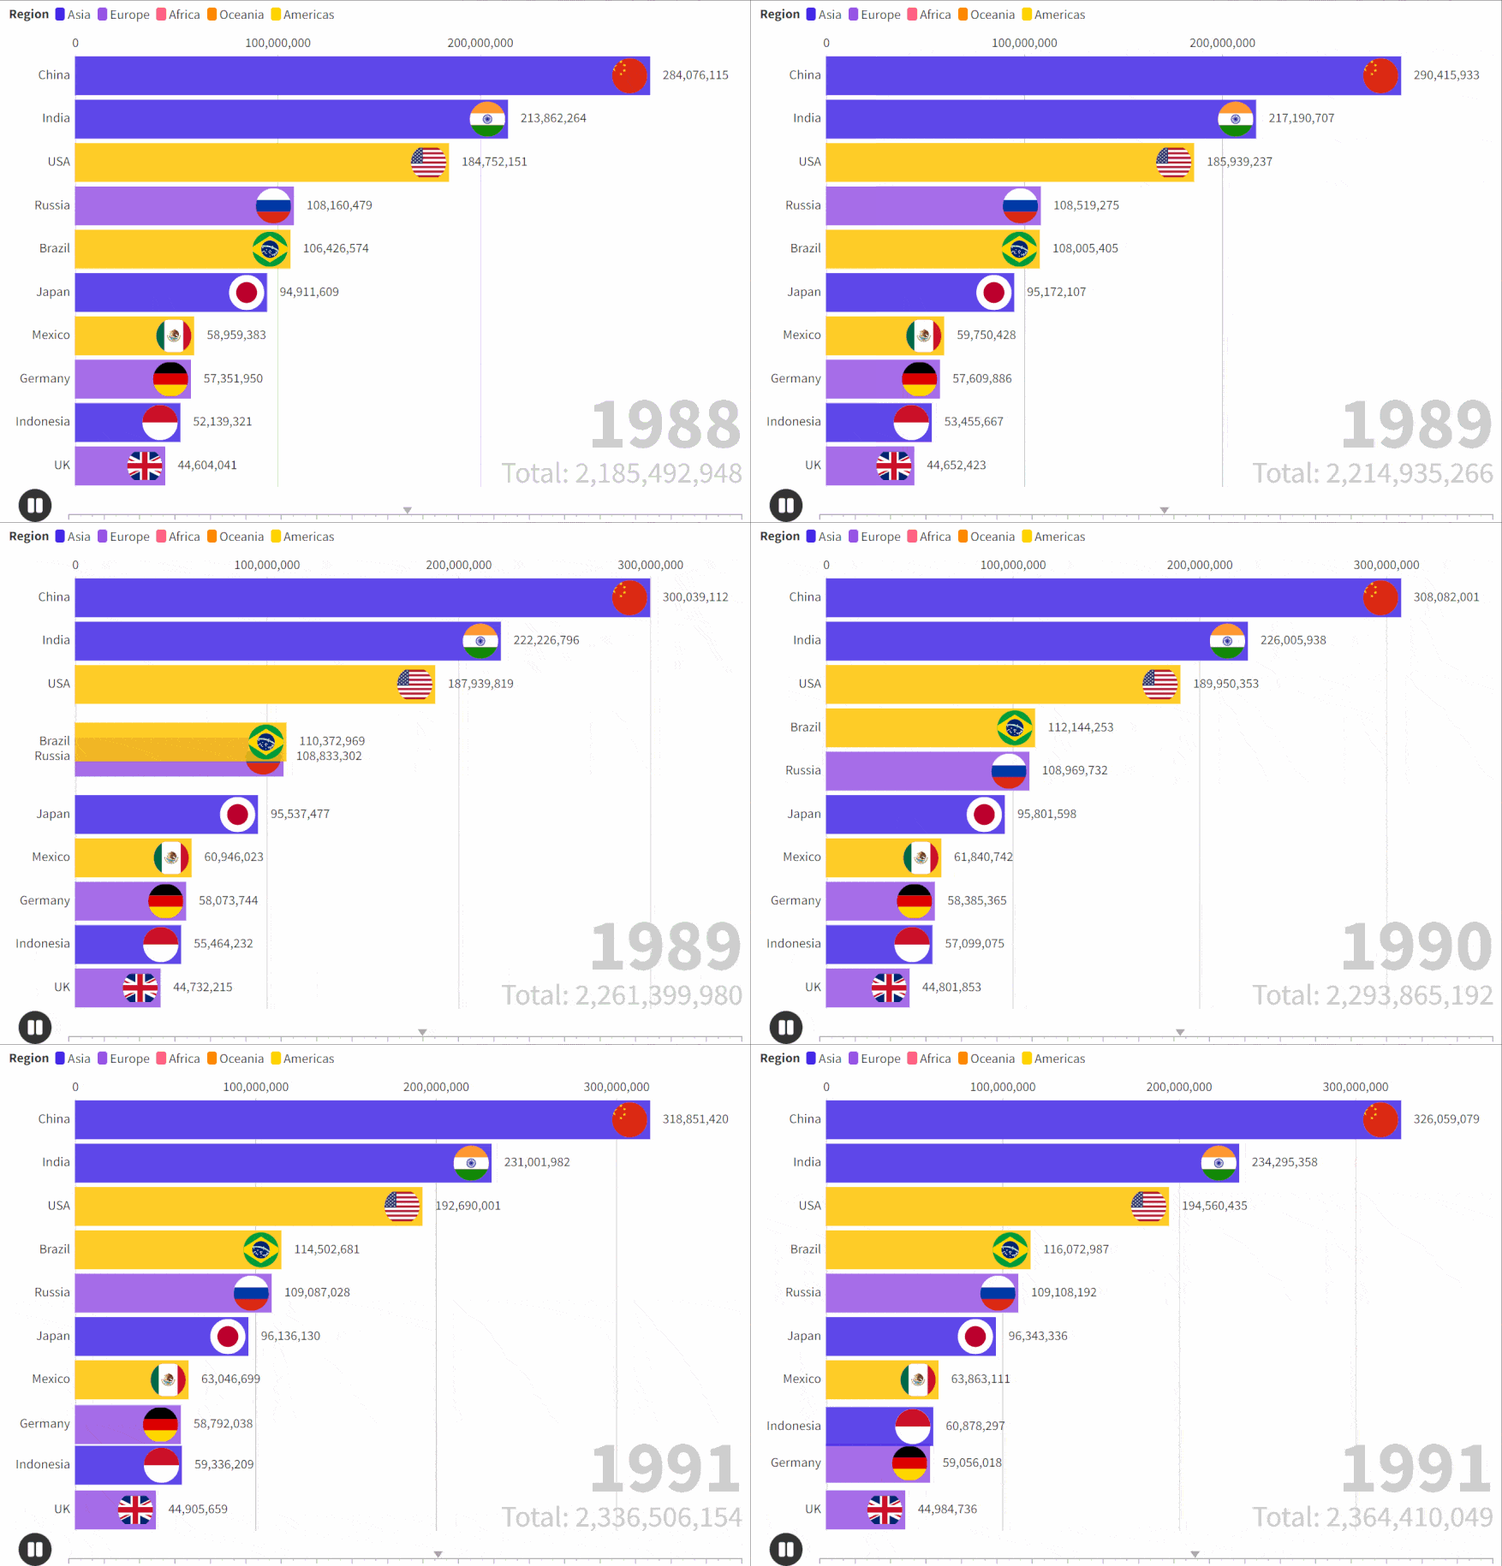
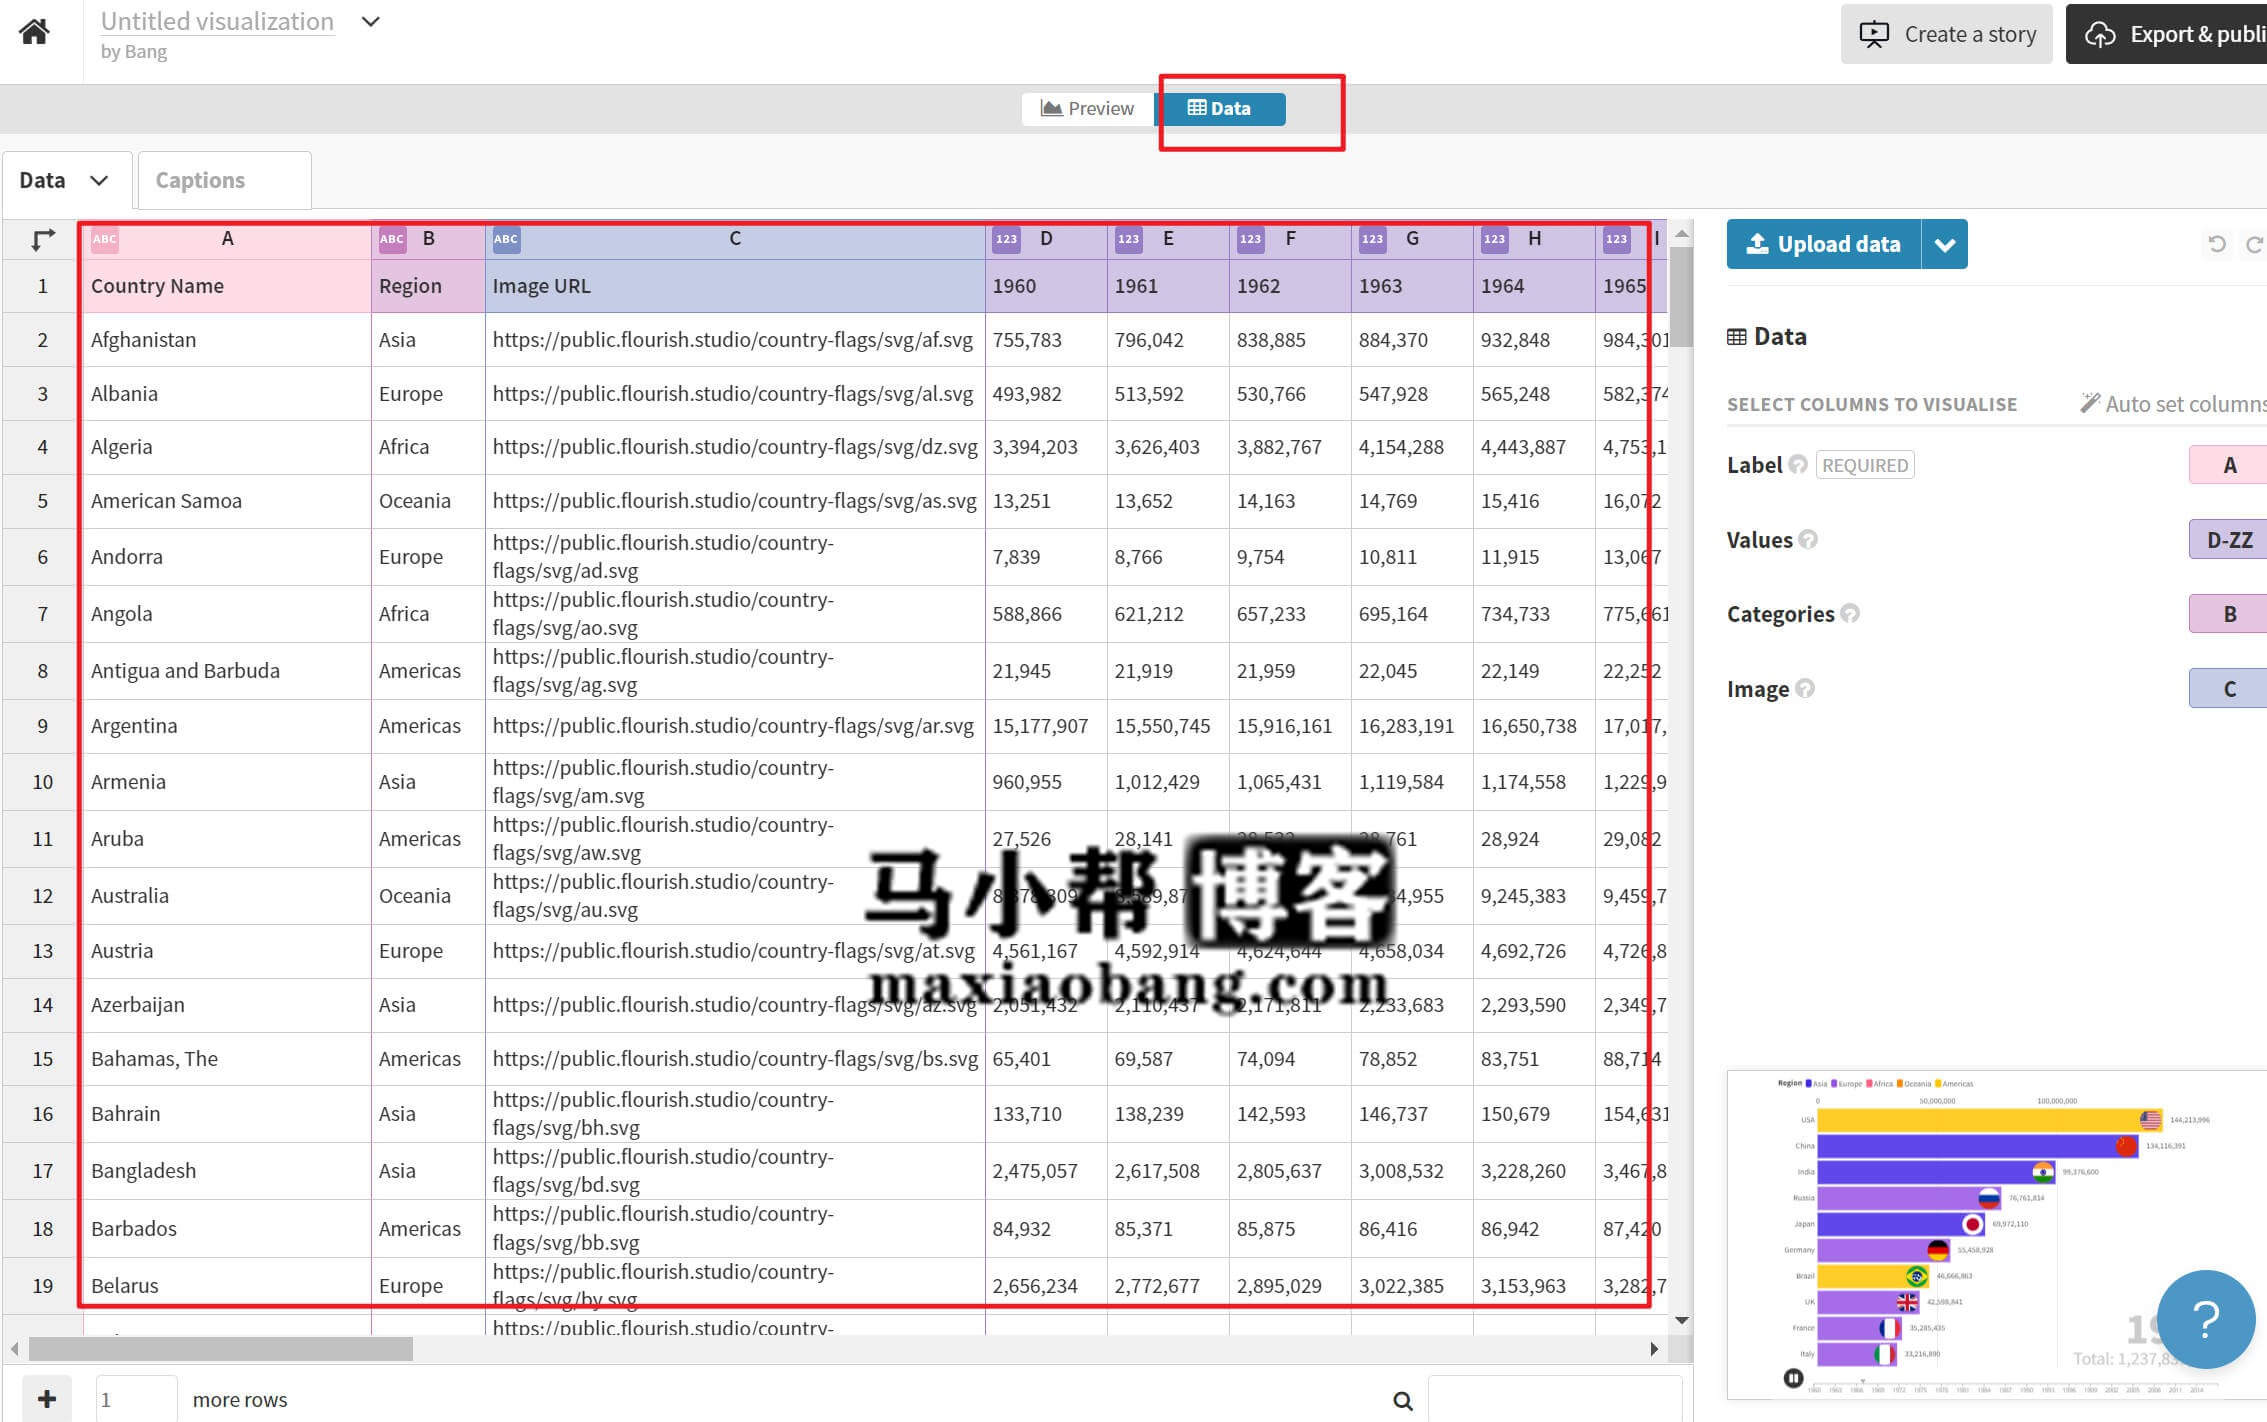
There is also this type of competition schedule chart – you just need to replace the data and materials used in it! Moreover, the color and size of the icons can be adjusted online.