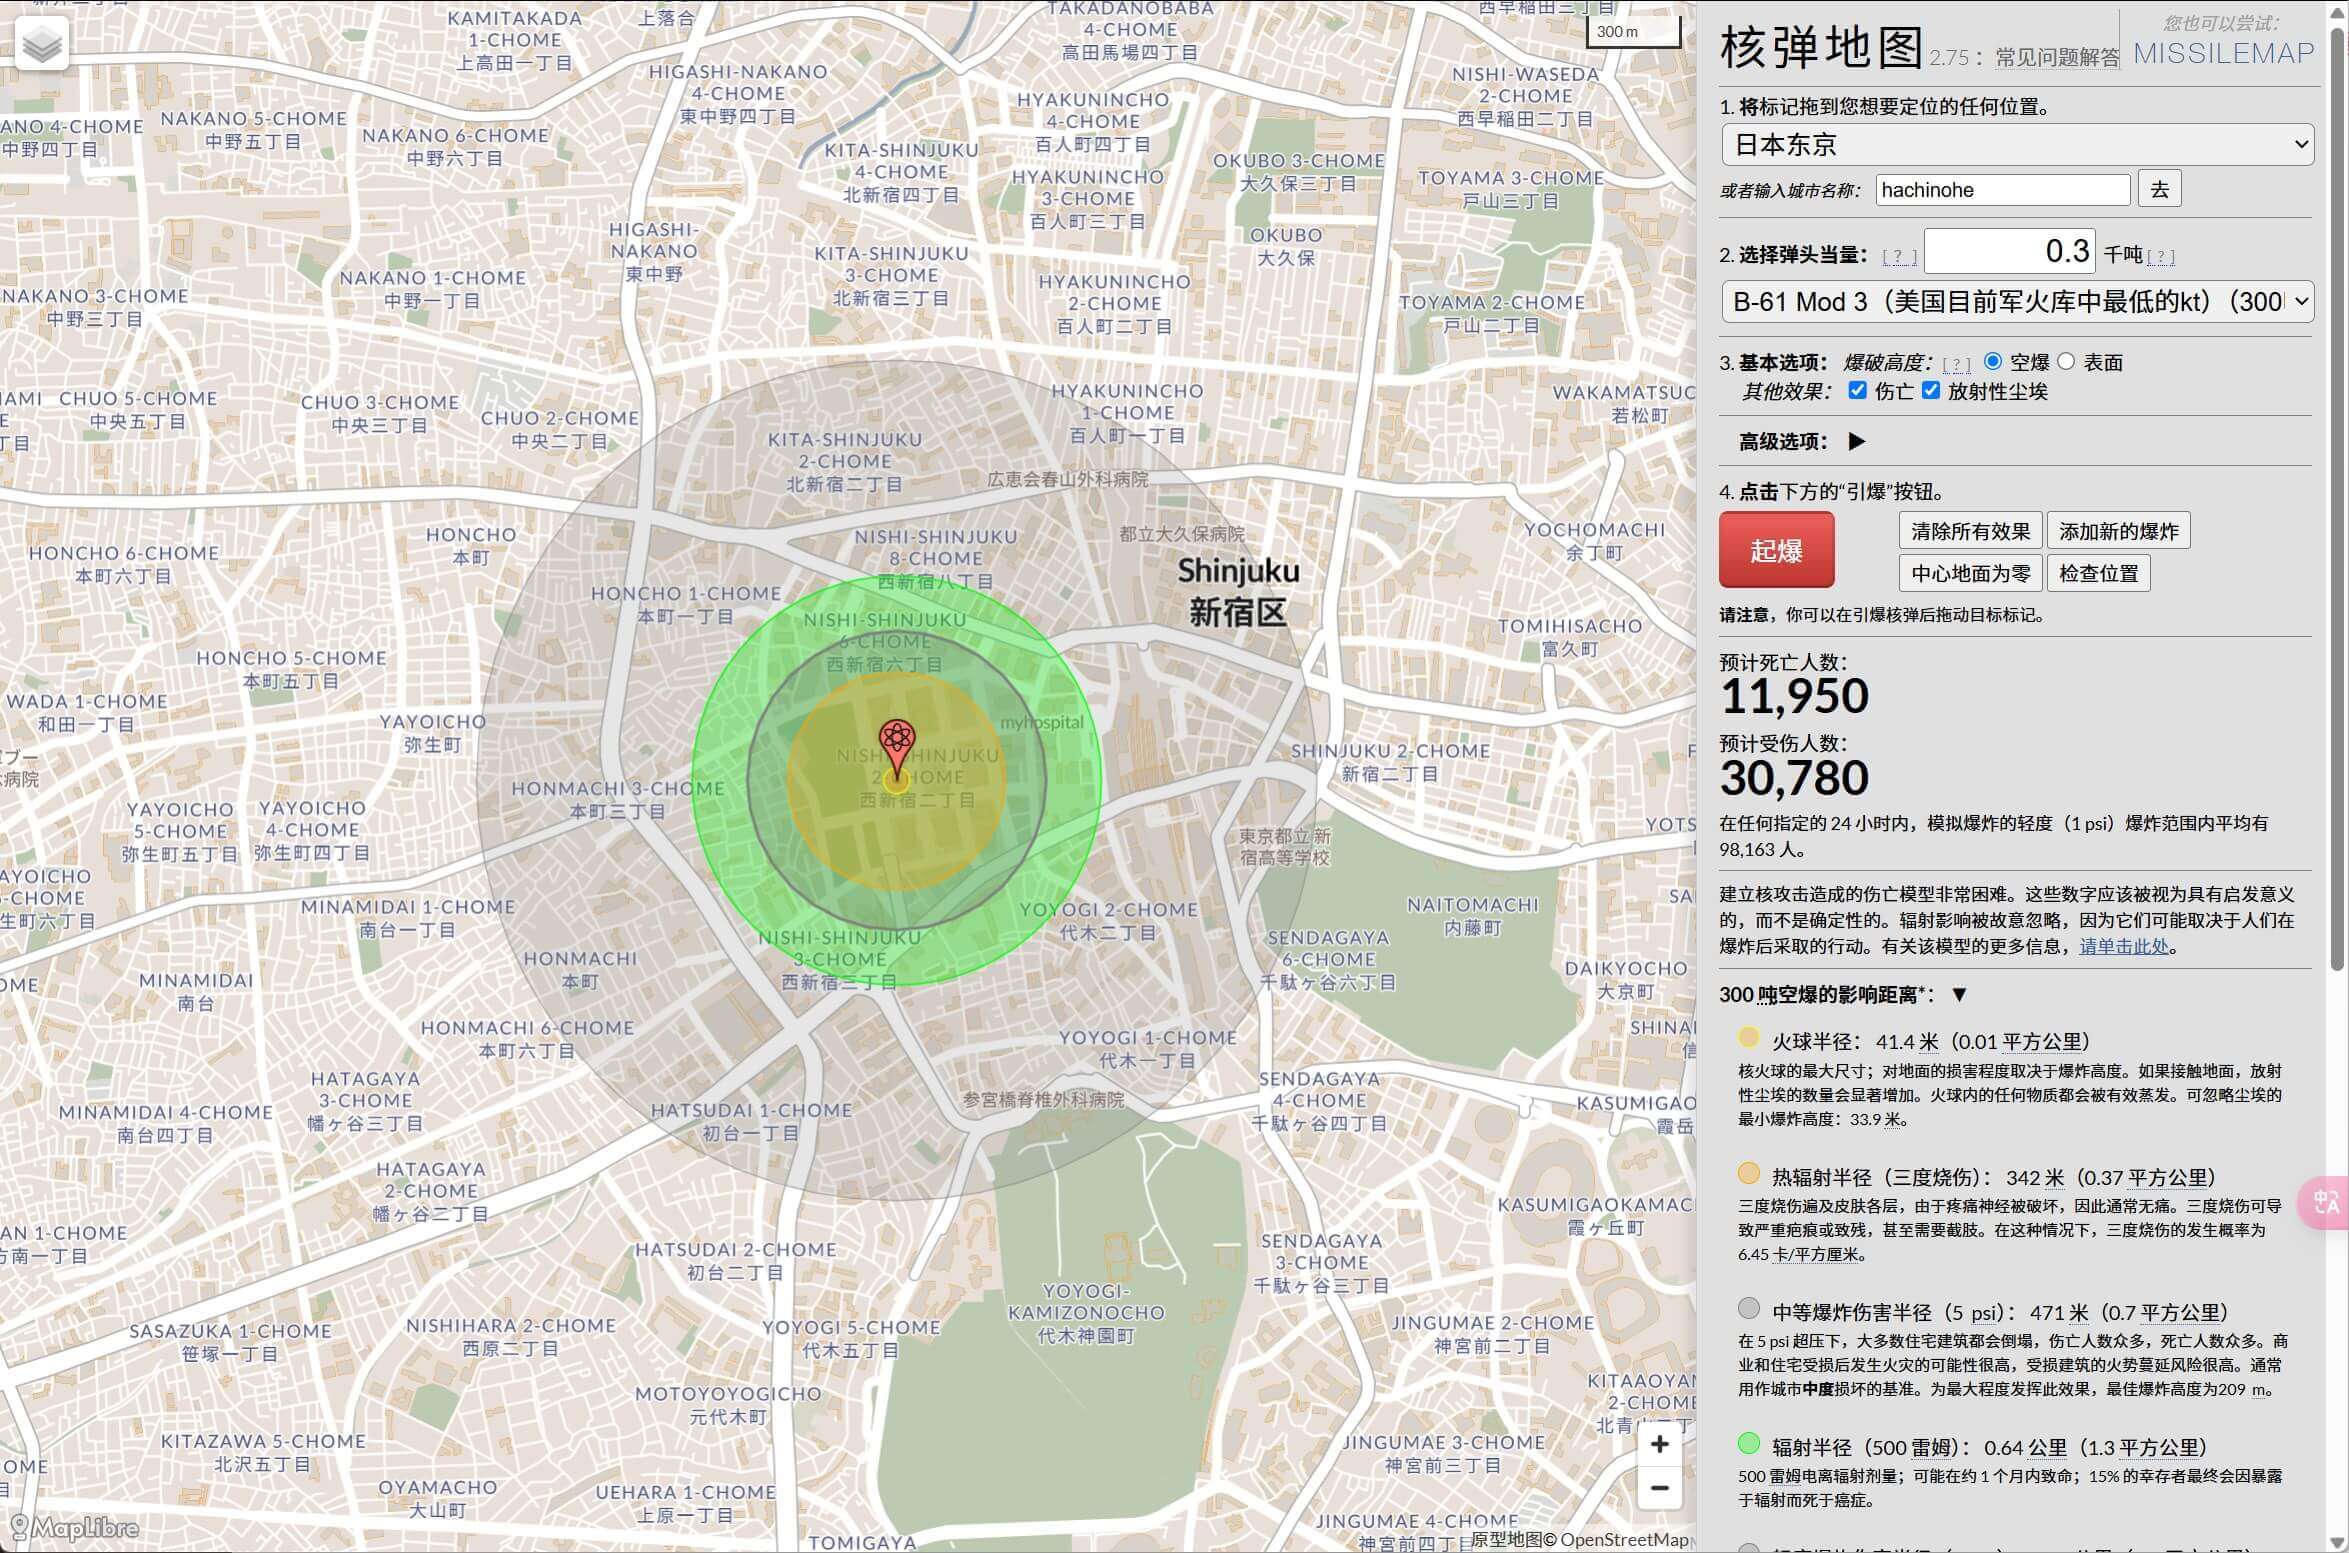
Nuclear bomb map NUKEMAP
NukeMap is a website for visualizing the effects of nuclear bombs. It uses open source physics and weapons models to provide a simplified view of the consequences of a nuclear explosion, helping people to intuitively understand the power of nuclear weapons. Supports inputting any city or specific location on the global map, and supports selecting the yield of the nuclear bomb (from historical
Introduction
NukeMap is a website for visualizing the effects of nuclear bombs. It uses open source physics and weapons models to provide a simplified view of the consequences of a nuclear explosion, helping people to intuitively understand the power of nuclear weapons.
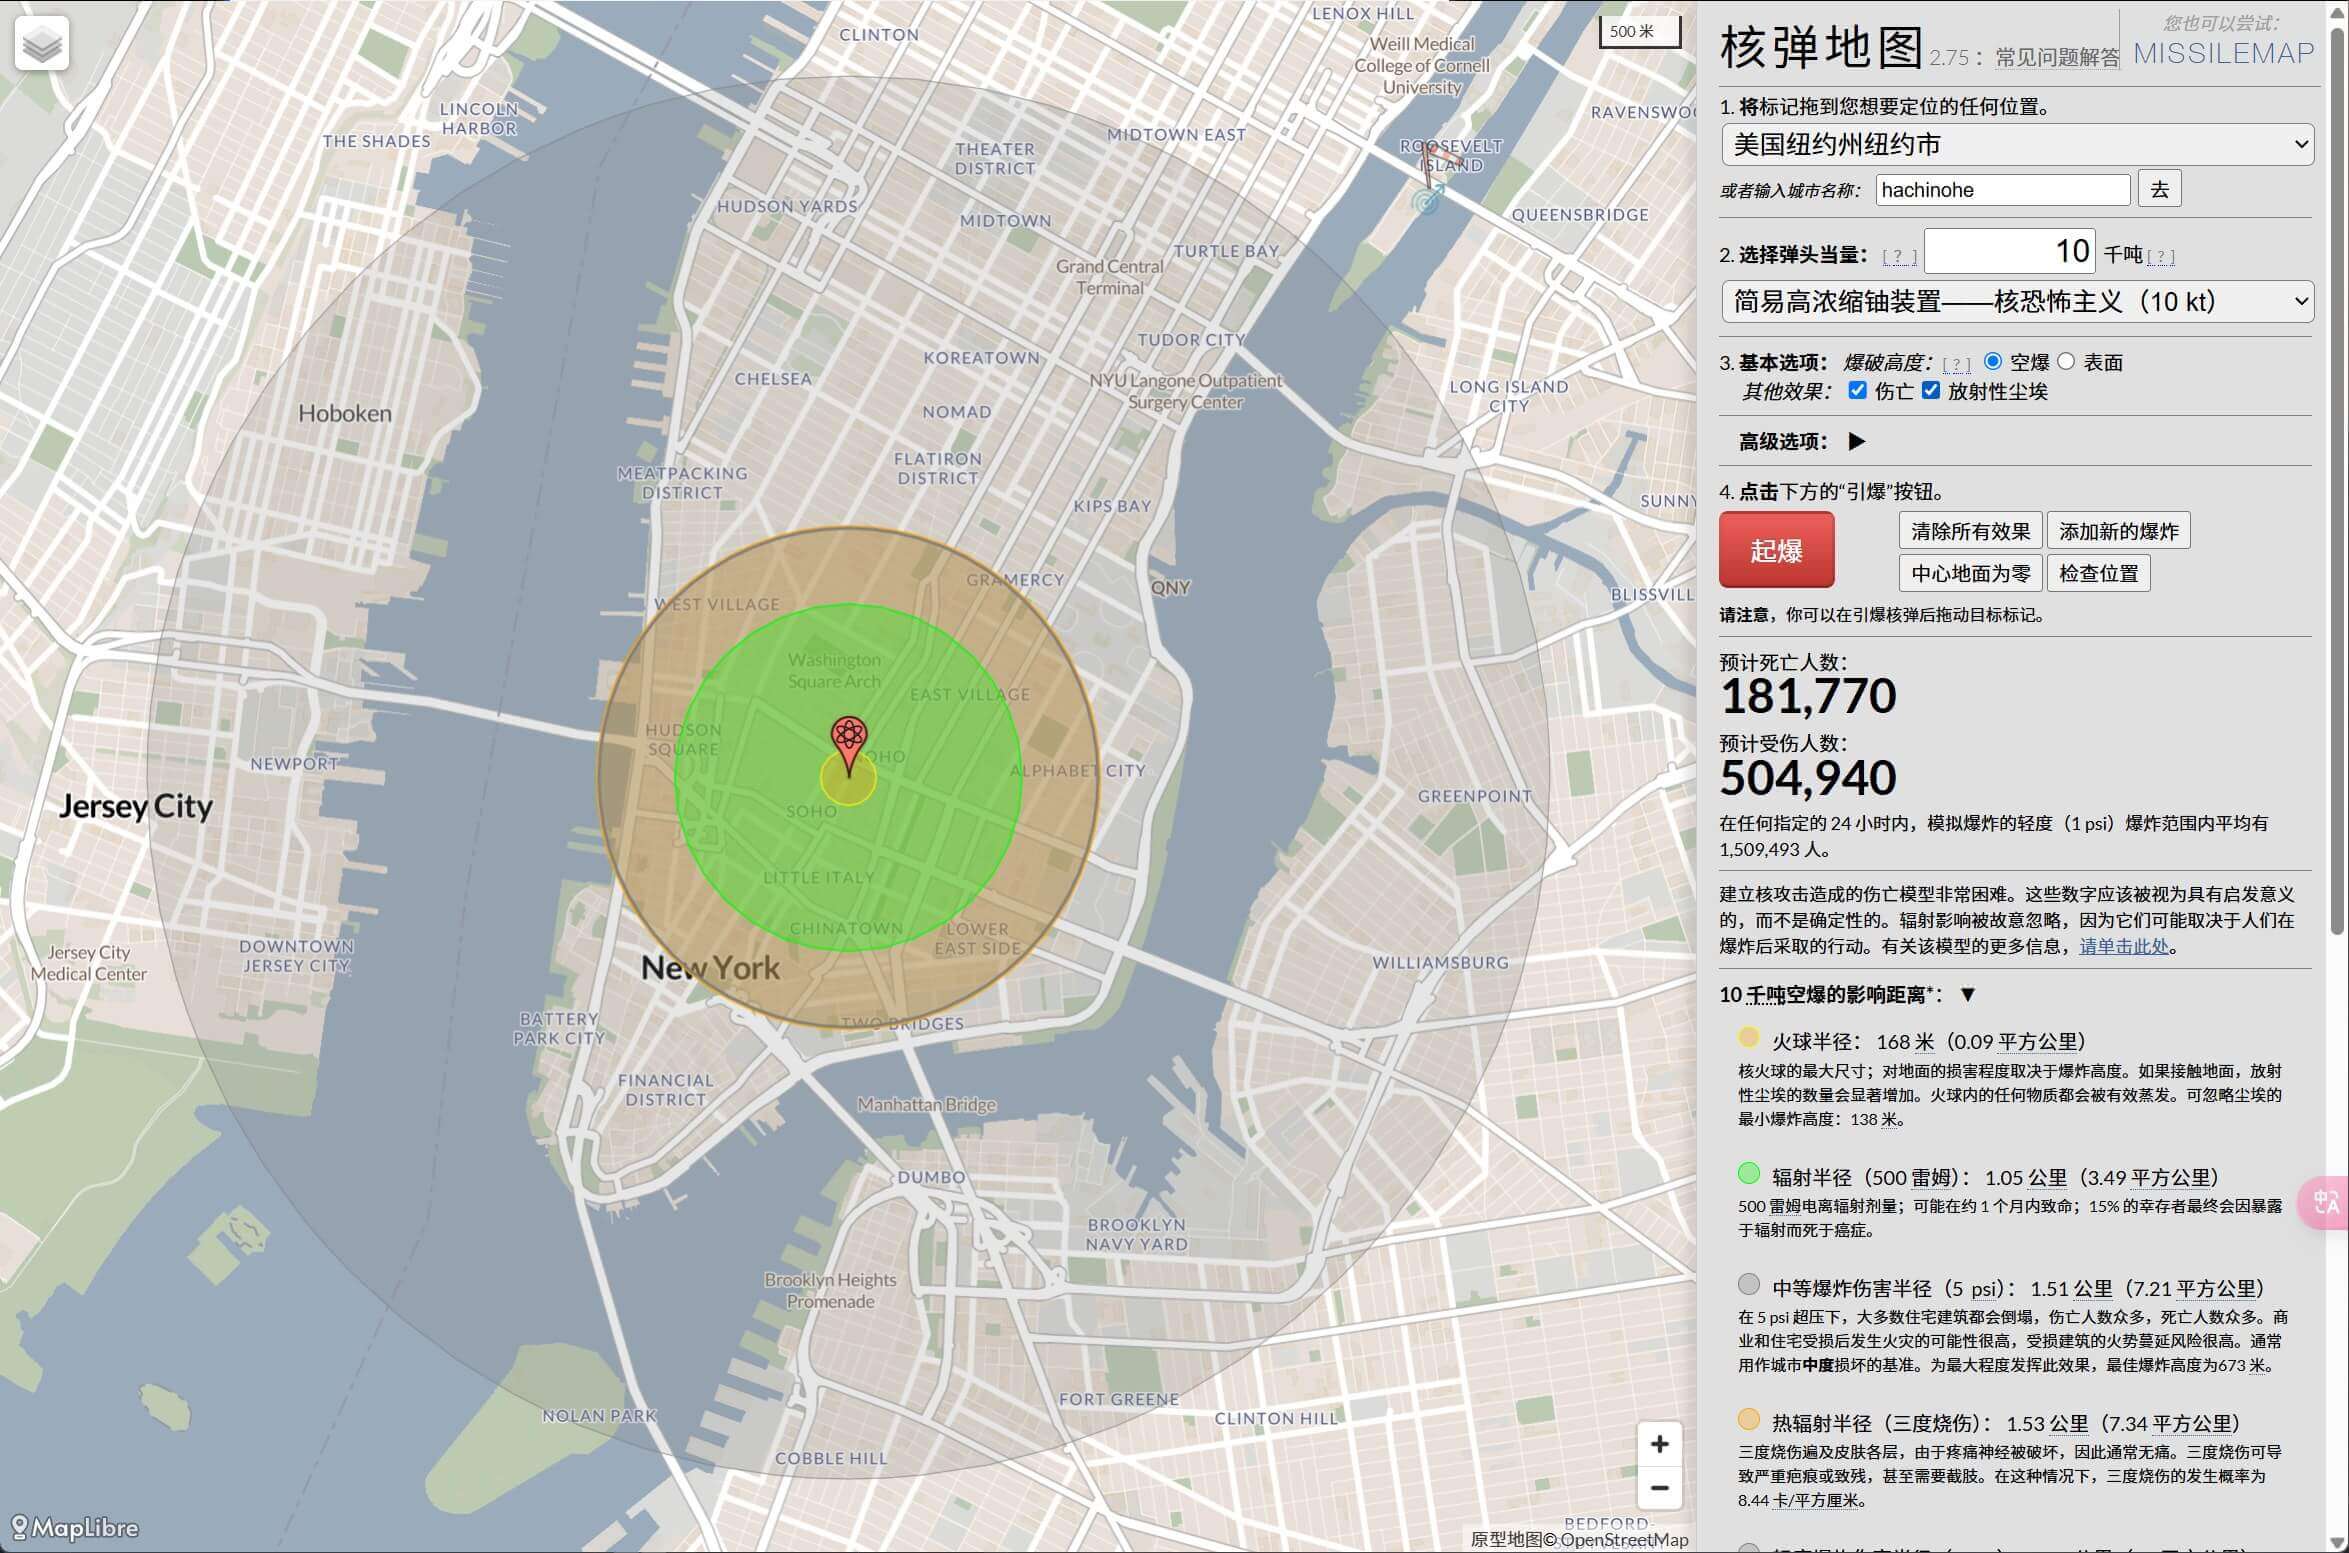
You can enter any city or specific location on the global map, select the yield of the nuclear bomb (from the historical "Little Boy" 15 kilotons to the fictional 100 megatons), and decide whether to explode in the air or on the ground.
After detonation, the impact range after the explosion can be generated, including the fireball radius, thermal radiation range, shock wave damage area, and possible casualty estimates. You can also enable radiation dust distribution simulation and even overlay wind direction data to view the spread of nuclear pollution.